
If you’ve been working with AWS for a good amount of time, you will likely have heard all about how important it is to have a solid tagging strategy. This is crucial for managing large environments, chargeback, and governance. What if you didn’t do that in the beginning of your deployment? What if you’re tasked with managing a large account that needs it’s tag strategy revamped? Sure, you can use the AWS Console and Tag Editor to make a large pass-through and tag everything to the best of your knowledge, but how to check your work? Cost Explorer can give you a quick amount of dollars for untagged resources – shown as ‘notagkey’ in your reports – but we can dive deeper than that.
In this blog you will create an AWS Glue ETL Crawler and an Amazon Athena Database that will query your CUR reports in S3 to give you the insight you need to get your tags under control . Gain confidence, build in AWS, and enhance your value. Ready grasshopper? Let’s go! At the core of this is the Cost and Usage Reports (CUR) which we will be using to build upon.
What is the CUR? The Cost and Usage Reports is the most comprehensive report you can run to analyze your AWS usage. It shows granular data up to the hour, and can break down your usage by day, month, product or tag. The CUR is updated three times a day. It can easily grow to over 1gb in size and exceed desktop spreadsheet capabilities. For this the CUR can integrate with Amazon Athena, Amazon Redshift, and Amazon Quicksight. There are also solutions available for regular email delivery of the file created by AWS Well-Architected Labs . In this blog you’re going to learn AWS with me and get a slice of some of the things the CUR can do.
Cost and Usage Report Setup
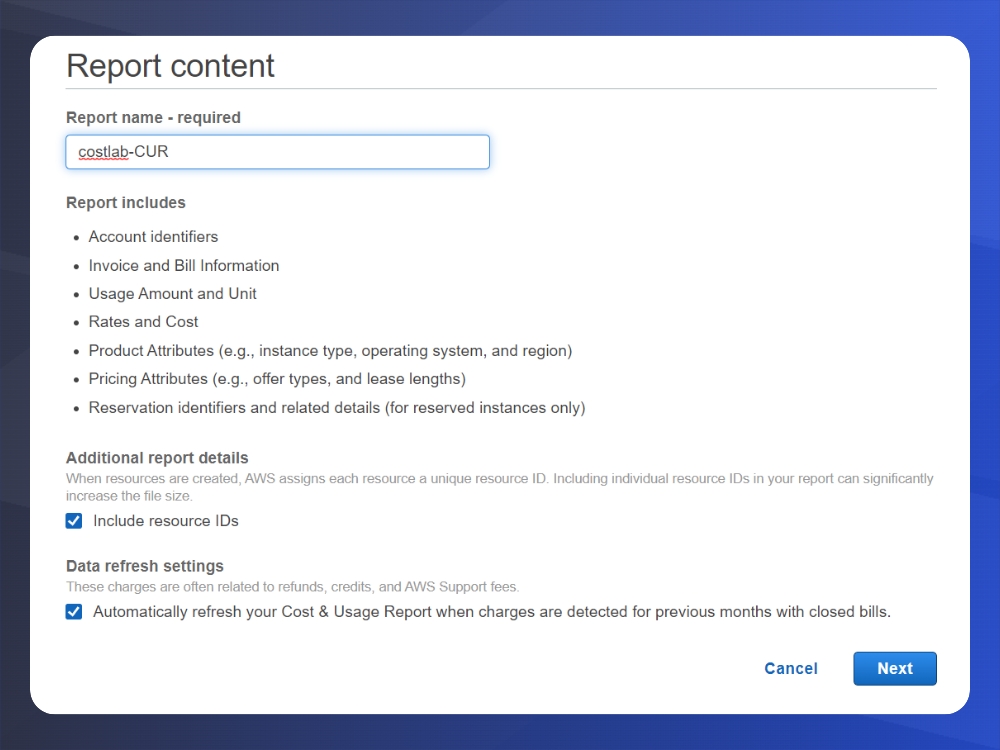
The first step is to configure the cost and usage reports for your AWS Account. You want to navigate to the Billing Console, and then from the left hand side menu, select ‘Cost and Usage Reports’. There we can create the report and point them to an S3 bucket that you own. For the analysis we will be doing, make sure that you select ‘Include Resource IDs’ in the first step, as seen below:
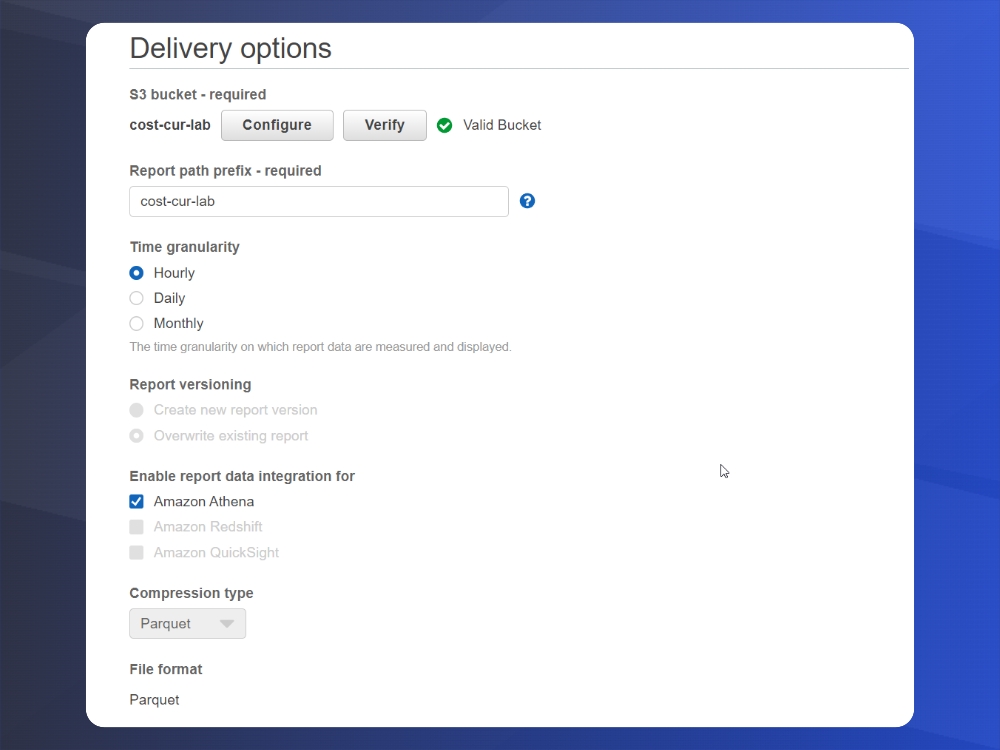
Here in the delivery options screen you can select an existing S3 bucket or create a new one from this dialog. Select your time granularity. There will be S3 charges associated with storing the Cost and Usage Reports, however, they are highly compressed in order to keep costs minimal. The most important part of this step is to enable report data integration for Amazon Athena. This is because we are going to be using some of the features from the CUR query library and want to query them.
Once this is setup, in 24 hours you will receive your first CUR. If you would rather not wait, we can also use sample CUR data, provided by AWS here.
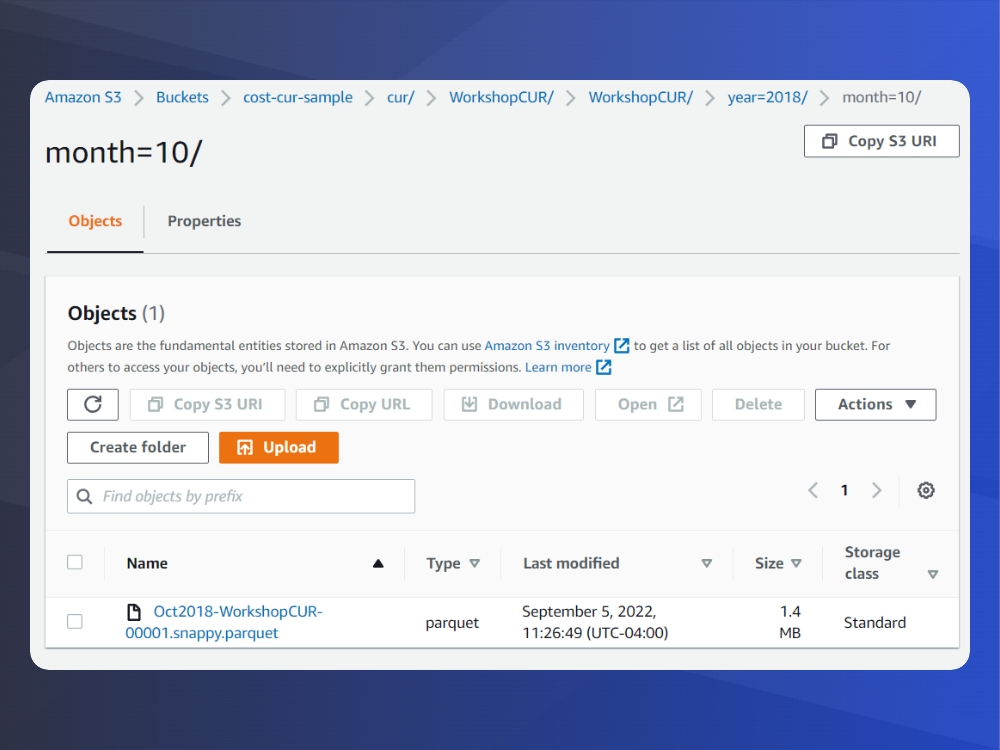
Create your S3 Folder Structure as follows: (bucket name)/cur/WorkshopCUR/WorkshopCUR/year=2018
After that create three folders for October, November, and December and place the sample .parquet files provided by AWS here.
When you are done, it should look something like this:
AWS Glue and Athena Setup
We will be using AWS Glue to setup a daily, scheduled crawler that will traverse the Cost and Usage report data to create a database and tables for the files. AWS Glue is a serverless, fully featured extract, transform and load service. Athena is also a serverless solution provided by AWS that we can use to run SQL queries against the data, and we are only charged for what we use – hence there are no charges being incurred 24/7 like a standard relational database management system. It can be used for very large data sets, and can also be used to query data lakes. That topic is outside of the scope of this blog, but there is more information and guides from AWS on that topic here.
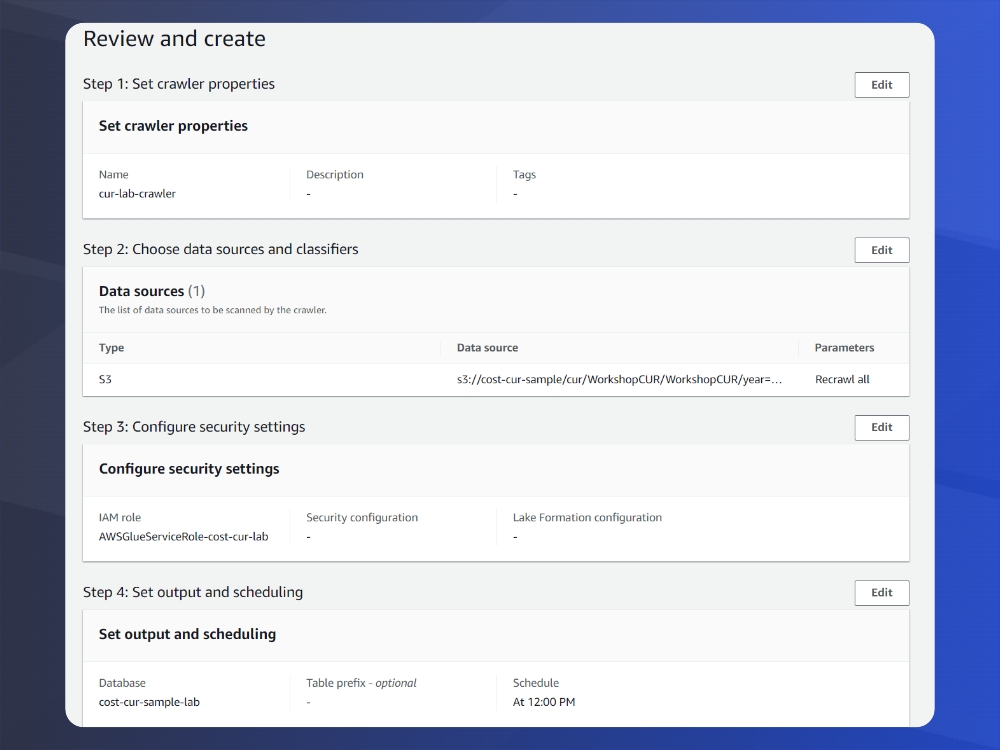
To begin, navigate to AWS Glue and create a new crawler. Select S3 as a data source and browse to the folder structure created. Remember to select to traverse all subfolders.
Create an IAM Role, and then Create a Database by clicking the ‘Add Database’ button in Glue. We are using the name: cost-cur-sample-lab which will create a database in the AWS Glue Data Catalog. Set how often you want to run the crawler, here we will select daily at 12:00. Note that it can also be run on-demand.
Once this is done, you’ll see your new crawler in a ready state. Select your crawler, and set it to run. For this dataset it should take less than 5 minutes to complete. There should not be any errors and you’ll see in the ‘Table changes’ column some details on new items created. For additional confirmation, click on view log and it will look something like this:
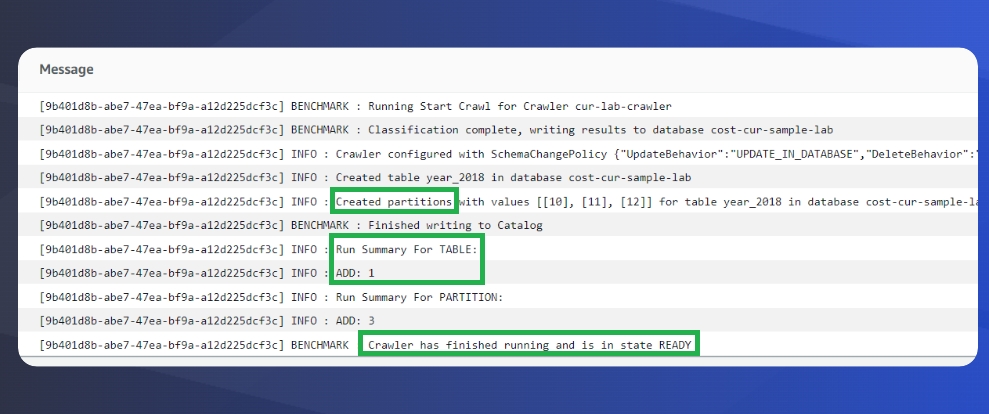
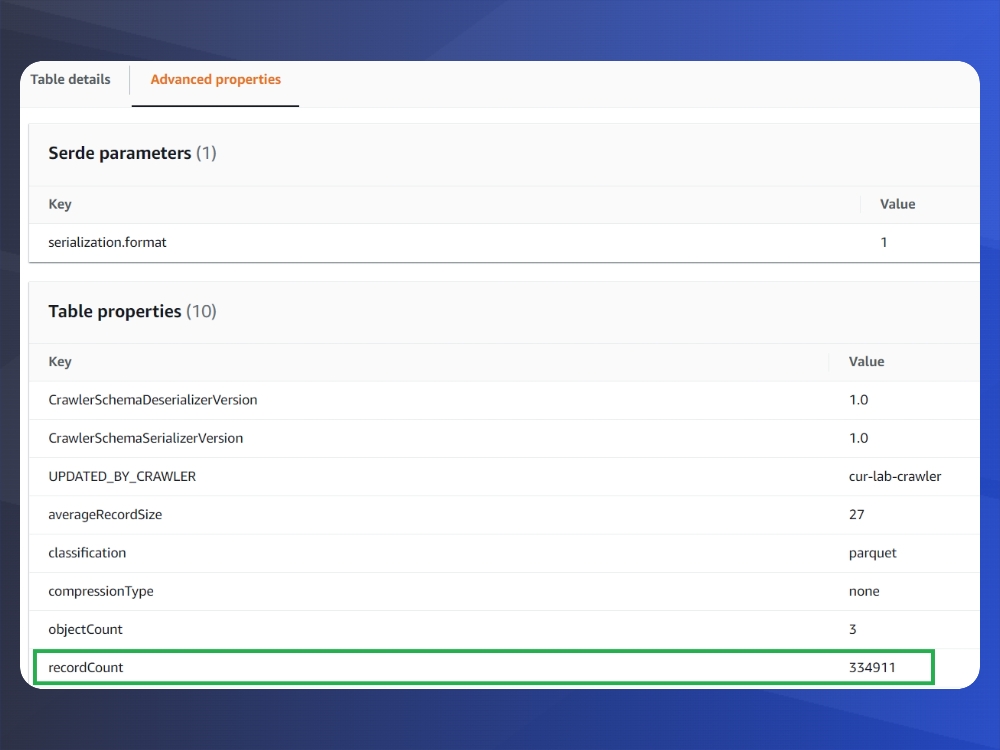
To make sure it worked, navigate to AWS Glue -> Databases -> select your table, on the screen that has ‘Table Details’ – Select the tab : ‘Advanced Properties’ and ensure that the record count is not 0. If it is 0, review the steps and retry. Make sure your IAM role is properly configured.
Athena Setup
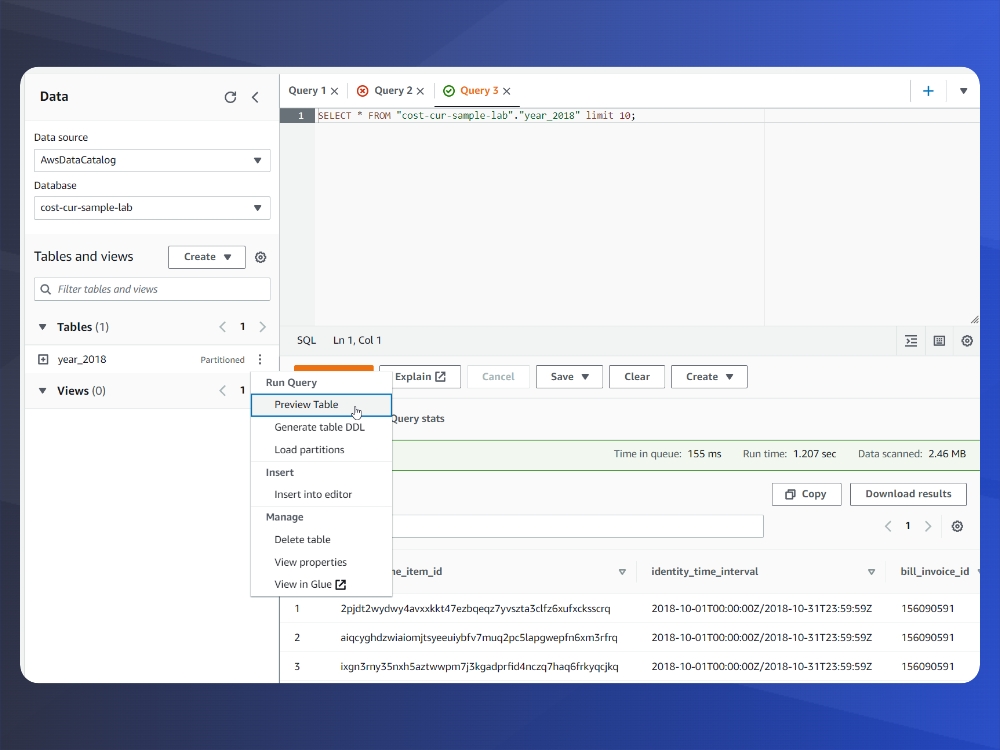
Now that our AWS Glue Database is created we will head over to Athena. Select your new database, choose the 3 dots next to your table and select ‘Load Partitions’. If you are using the sample data as in this blog this step may not be necessary and the data may already be partitioned. Next, click on ‘Preview Table’ to see your data.
If this worked – Congratulations! You have successfully setup your CUR file to be analyzed and queries via SQL. For various use cases, I invite you to peruse the AWS CUR Query Library.
Tag Coverage Query
In some of my work I have found it to be vital to understand tag coverage across an enterprise. This can be setup in a parent account and the query\CUR data will span all AWS Accounts in the organization. Very powerful and useful to understand and align your tagging strategy.
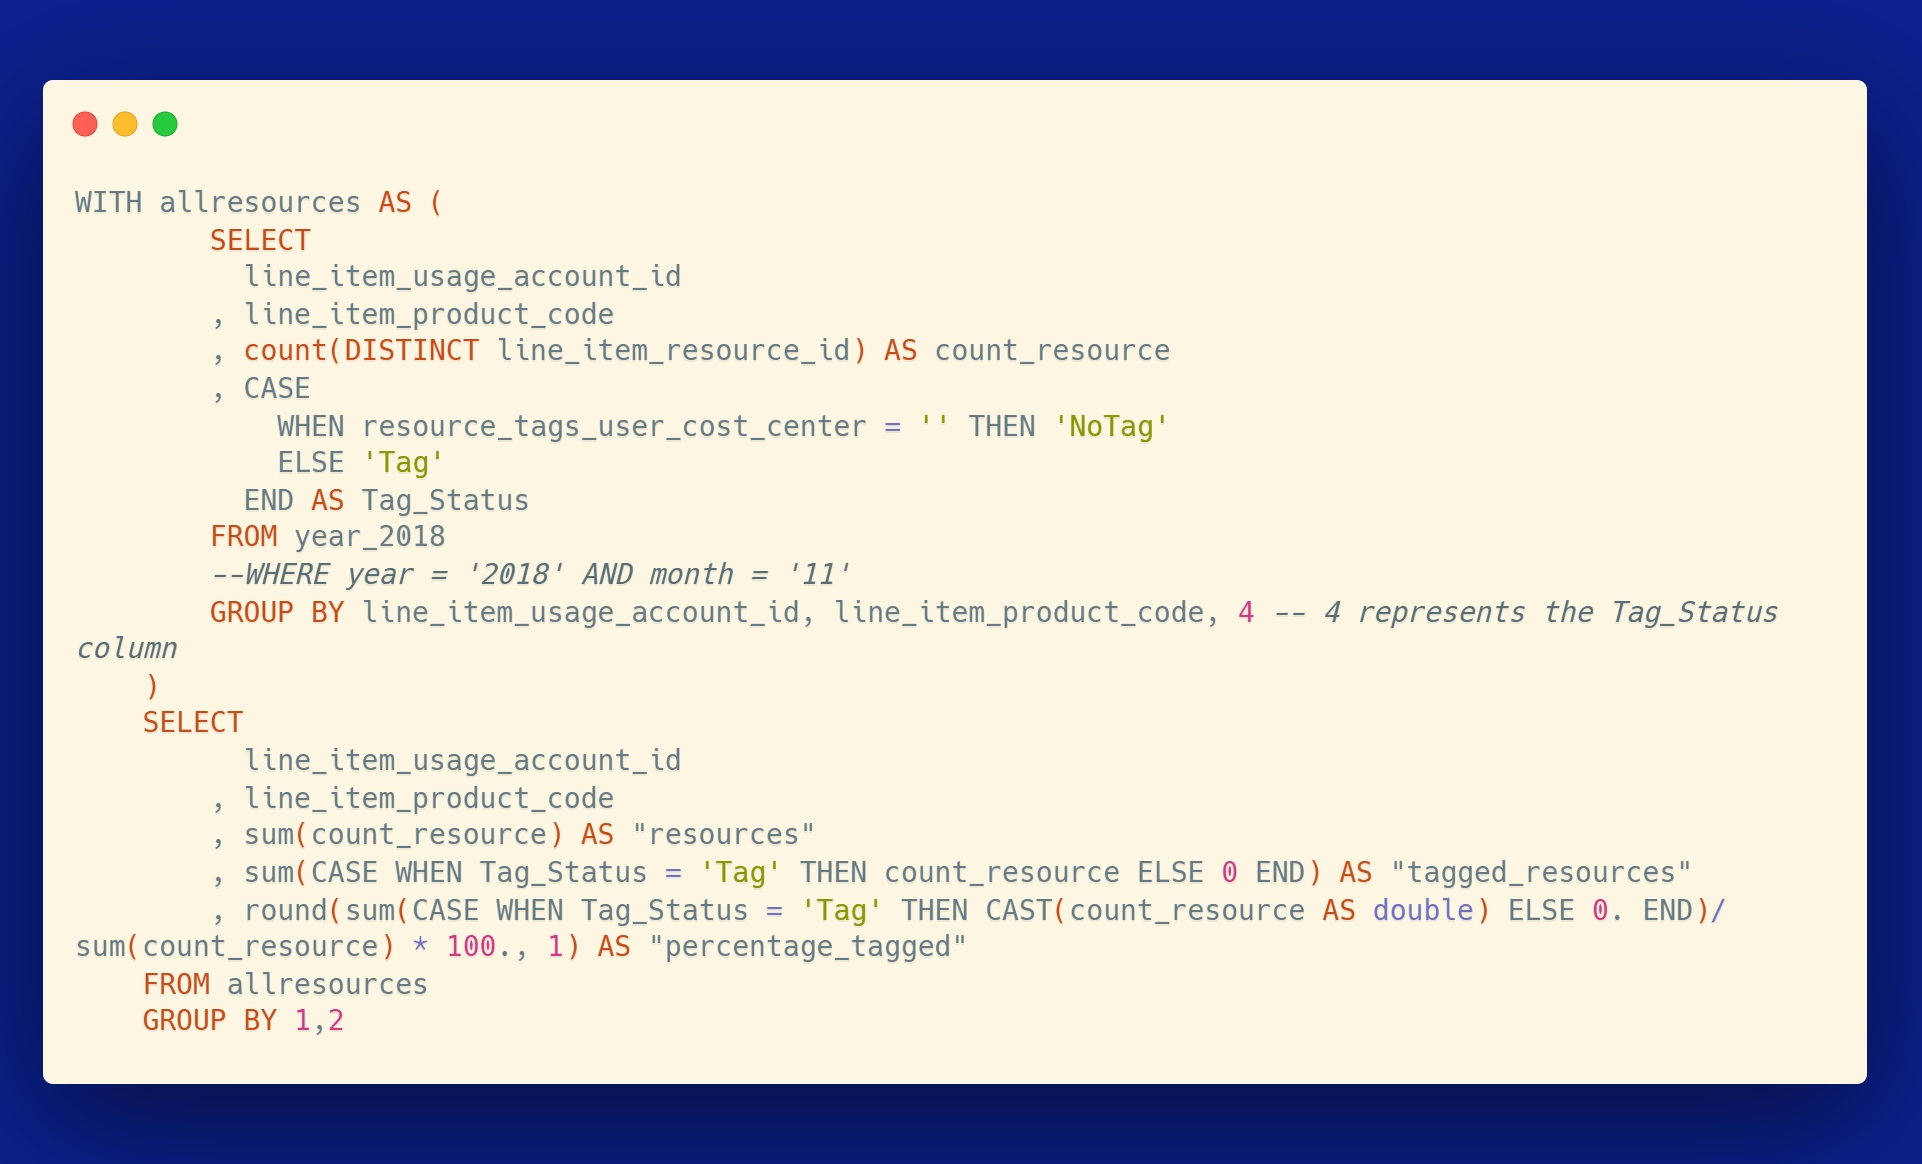
First, to see the tags in use you want to use this query – it’s important as the formatting may be slightly different in SQL vs what you are seeing in the AWS Console.
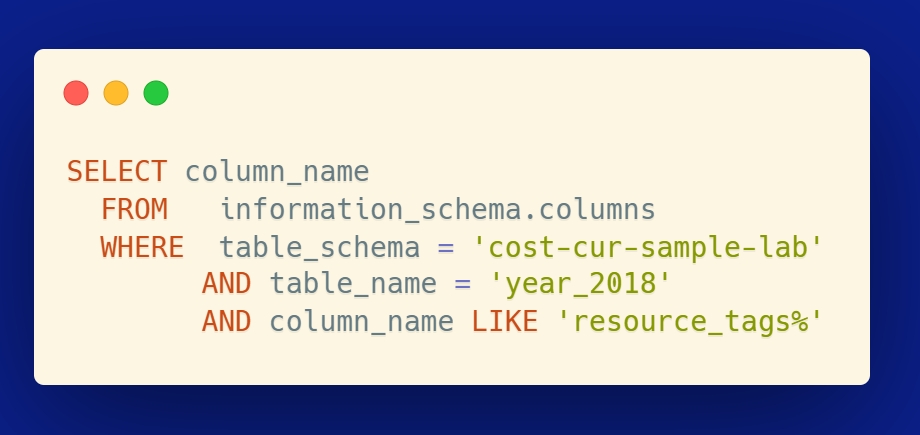
Let’s use resource_tags_user_cost_center to see cost center coverage for the organization.
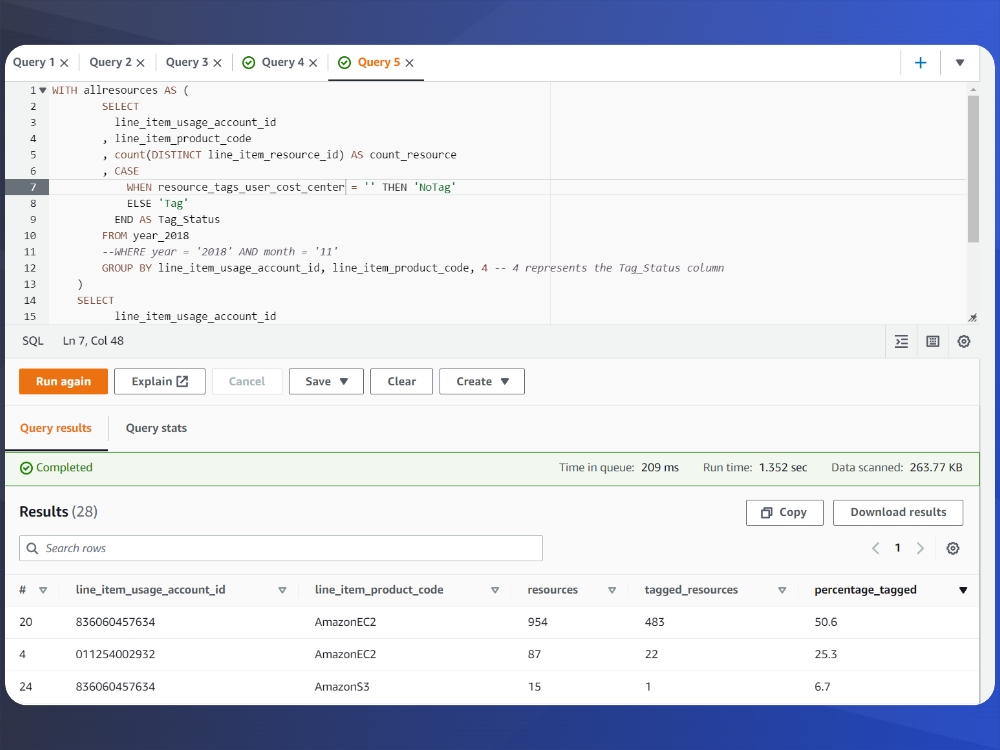
Here are some important callouts from the query output:
- Note the account ID column, we are scanning and getting results from multiple AWS Accounts
- Product Code will tell us which AWS Service we are looking at for the current row
- Percentage tagged will tell us how thorough our tagging efforts are
- To further drill down into this you can use AWS Cost Explorer and Resource Groups and Tag Editor to understand and correct missing tags
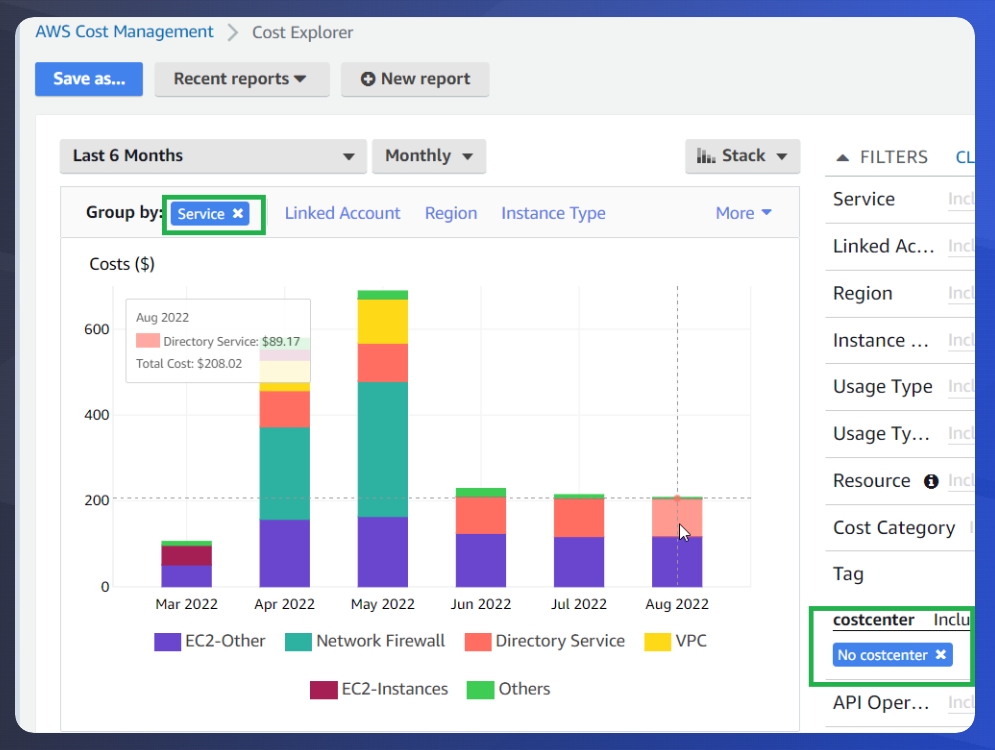
Now that you have your data, the results can be downloaded as a CSV file for further analysis and filtering. In our example, we are looking at EC2 and S3 as some of the tag coverage targets. We can use Cost Explorer filters to drill in to specific components that are not tagged. To get this data, Group by Service and then on the right hand side, select Tag and for costcenter, select ‘no tag’ to focus only on untagged spend.
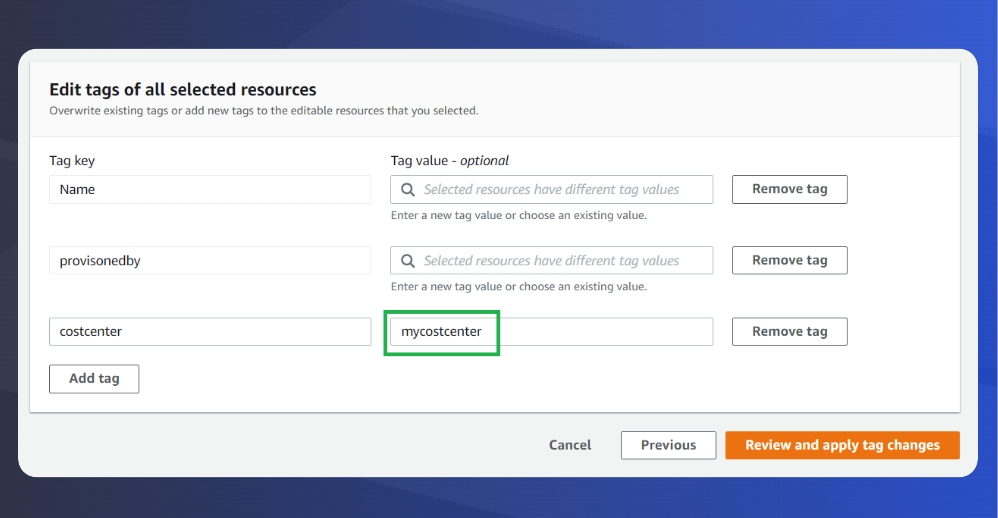
To bring things full circle, let’s go to ‘Resource Groups and Tag Editor’, here we can select the regions we want to filter by, resource types – in our case I’m selecting a subset of EC2 instances, and then Tag keys – you can leave it blank or filter further by the presence or absence of selected tags.
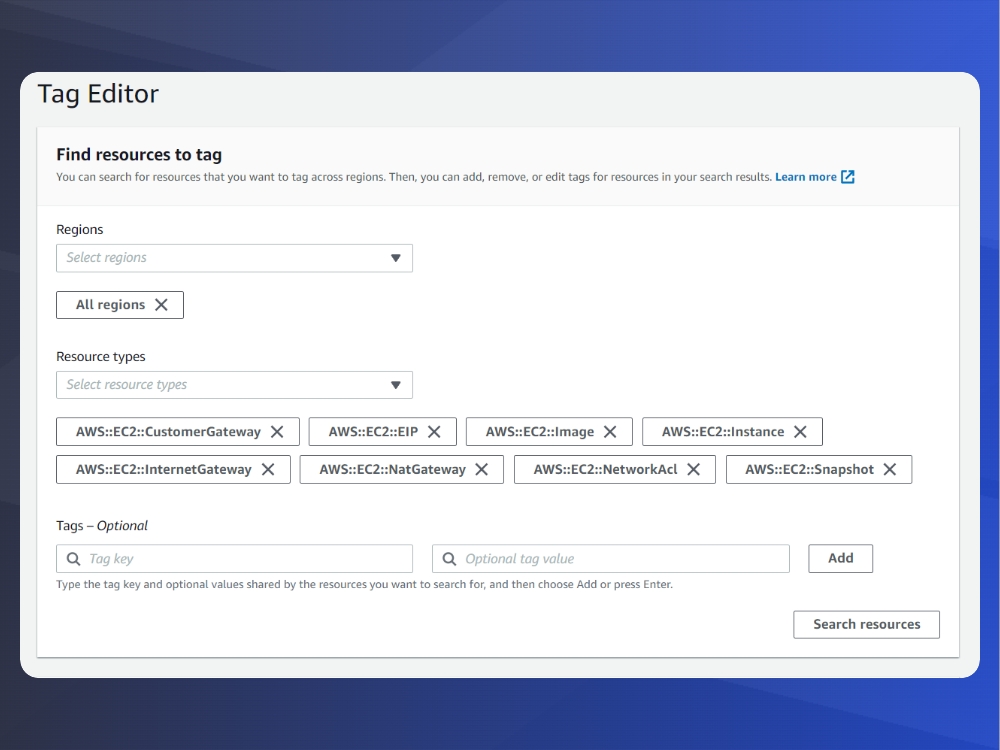
Review the results, select some or all that you wish to edit, and then you can add the missing tags to match your tag policy. Using this powerful feature you can update tags of up to 500 resources at a time.
Conclusion
If you’ve made it this far – Congratulations! You now have tools and hands-on experience to utilize three powerful AWS features : Glue, Athena, and the Cost and Usage Reports. I encourage you to continue learning, training, and deepening your AWS knowledge.
Further Reading

Jorge Rodriguez
Lead Cloud Engineer
[email protected]


